The Blog (Returning Soon)
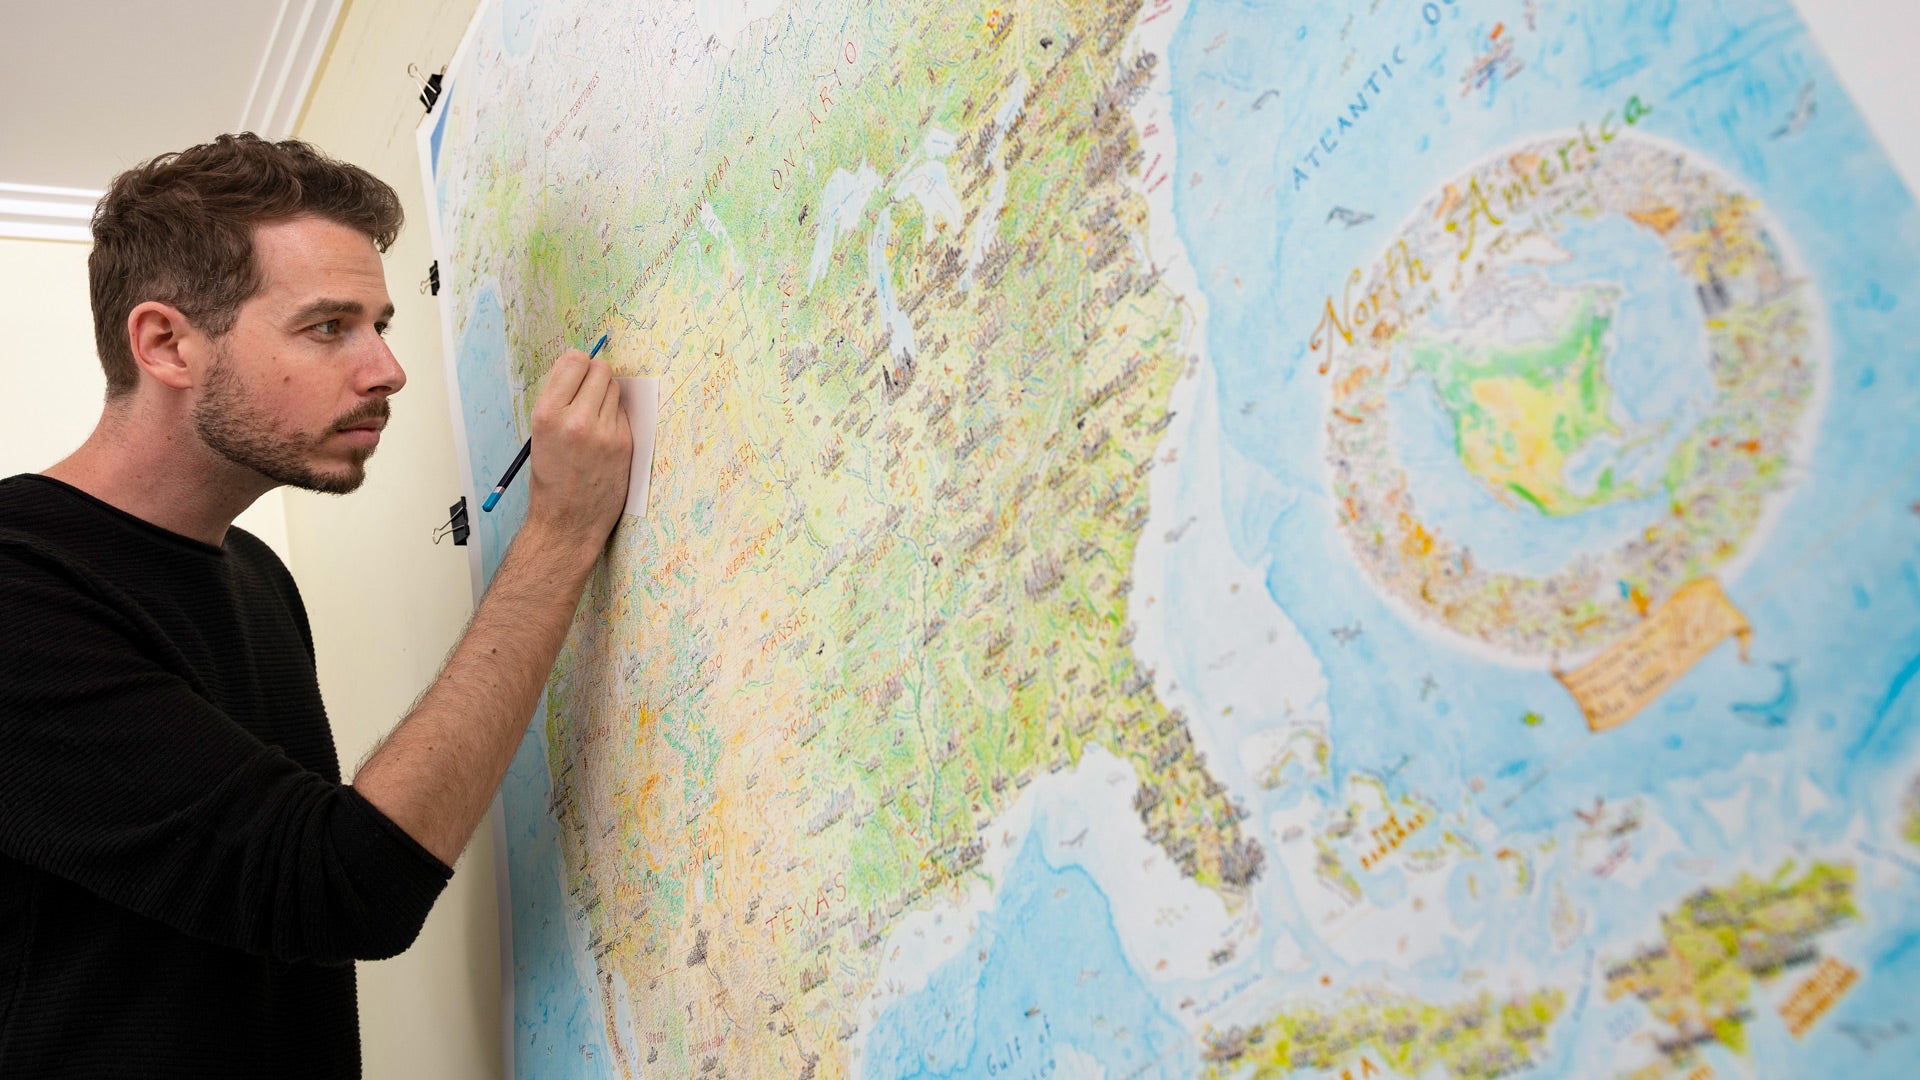
From 2016 to 2022, I kept a blog on my website. It explored my maps in-depth, along with themes and ideas that fascinated me. It was a behind-the-scenes look at both North America: Portrait of a Continent and Wild World, as they were being drawn.
Due to a recent website rebuild, the blog is currently unavailable. But everything was archived, and we'll be posting the old blog posts here very soon. We're hoping they'll be live again by September 2025.
For now, please check out my Substack: A Cartographer's Journal, where you can read about my more recent projects. And if there's any particular blog post you're interested in reading, just email me at welcome@antonthomasart.com.
Many thanks,
- Anton

Blog posts soon to return:
- Wild World and its continents (Nov 2022)
- Re-imagining a map: South Asia & Australasia (Dec 2020)
- North America Map: the Basics (Aug 2020)
- A Tour of North America II (April 2020)
- A Tour of North America I (Feb 2020)
- New maps and new mountains (Jan 2020)
- How do you finish a map? (Dec 2019)
- Where on Earth is the map? (Sept 2018)
- The Triple Divide (Dec 2017)
- Quick notes on Nevada (Aug 2017)
- Trauma in a pictorial map (Feb 2017)
- Son Cubano, Columbus and the painted snail (Oct 2016)
- Fidel's revolution, Guantanamo and the thaw (Sept 2016)

If you'd like to know more about my work and the stories within it, be sure to check out the Videos page. From lectures to interviews to map deep-dives, there's a lot of material to explore.